
Statistics · Matches and analysis
The numbers of the whole season, not just one match.
Every scout file you upload adds up. Win rate, sets and points won and lost, winning and losing streaks, attack, reception, serve and block trends over time, plus the detail for every player. Monday-morning questions, with an answer.
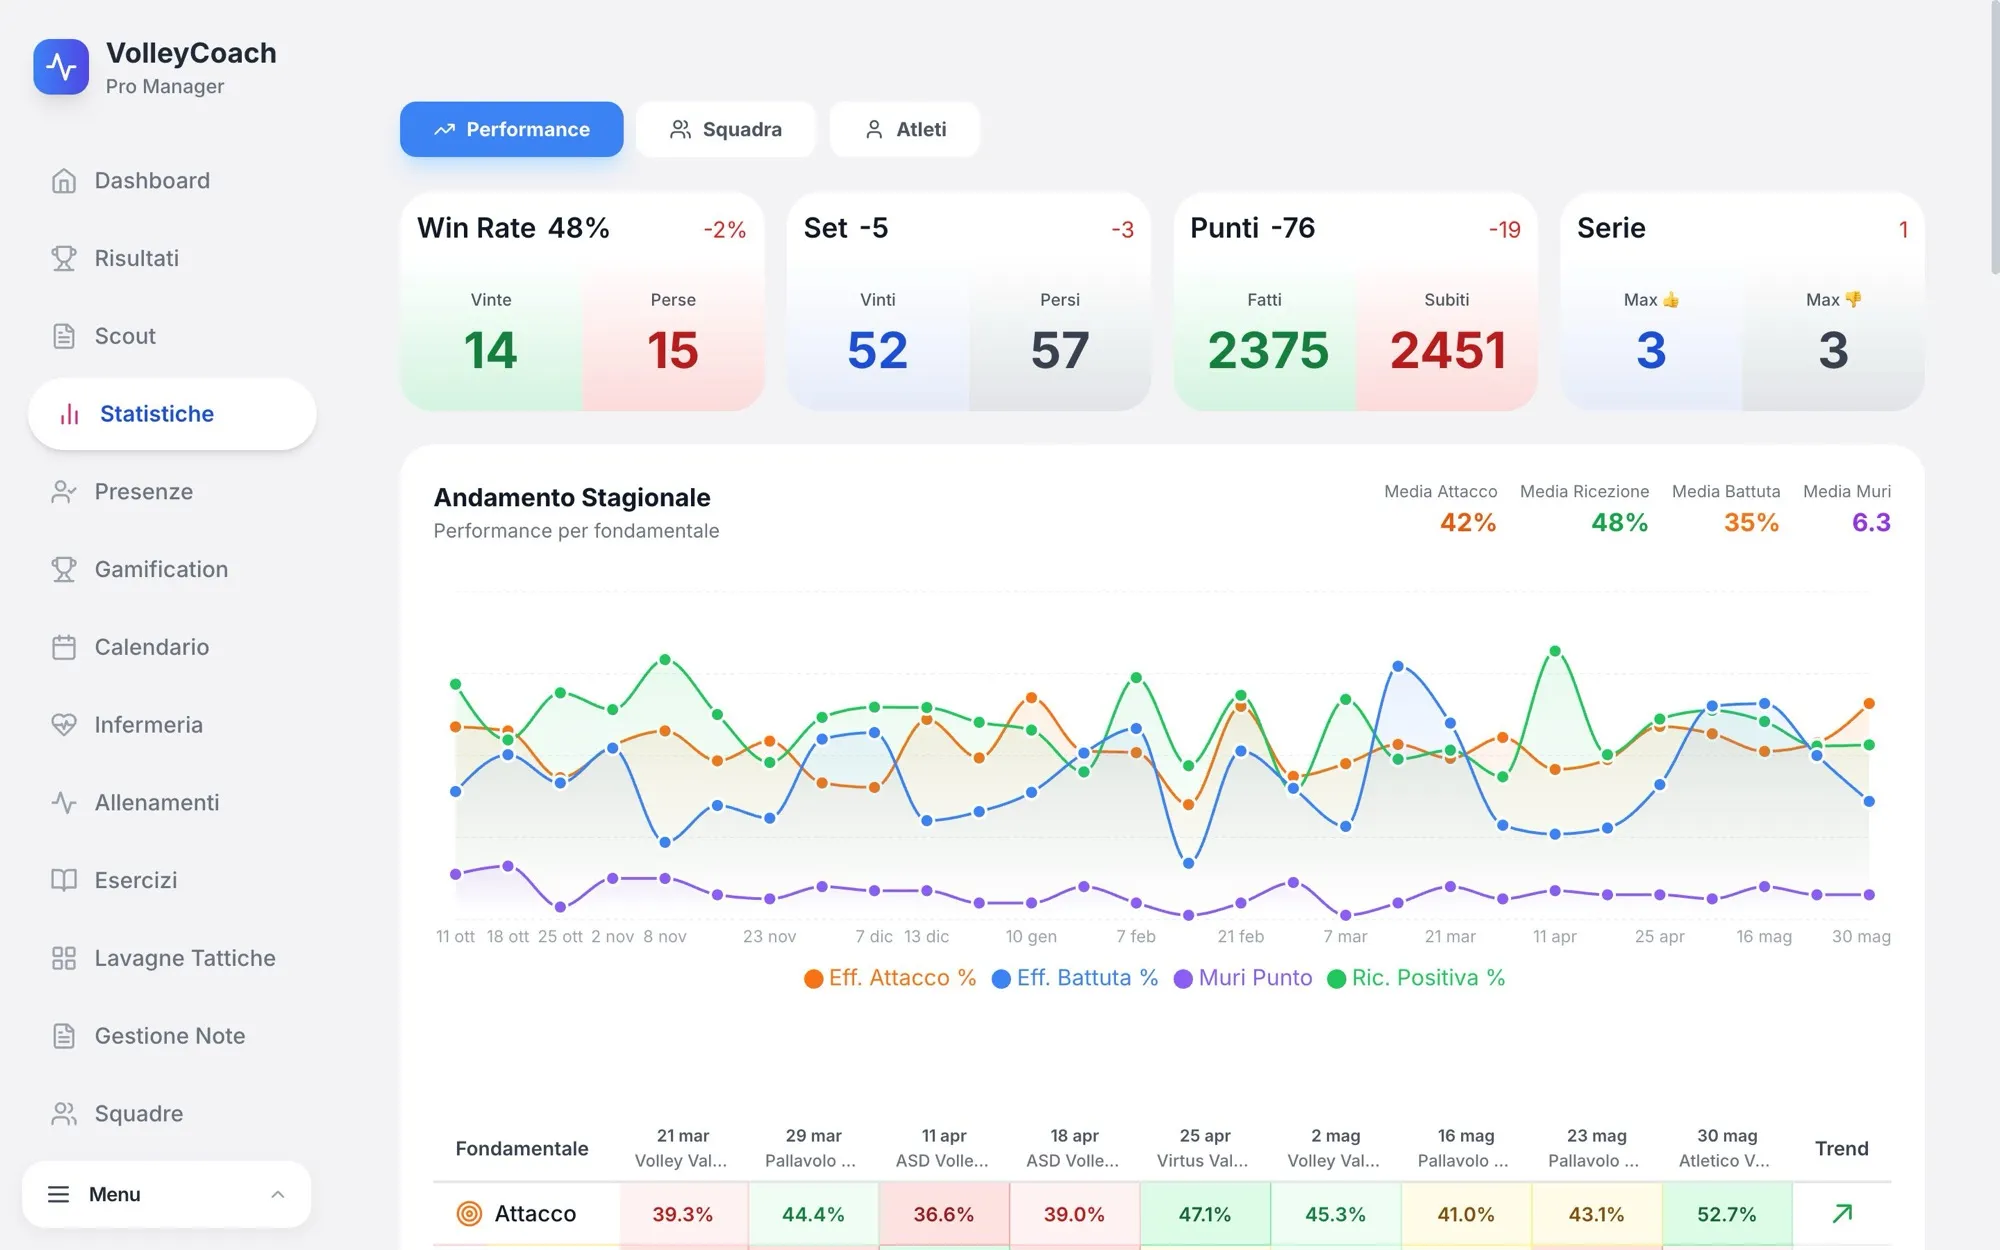
Real screen from the demo account, made-up data. The app interface is currently in Italian.
Inside the statistics
The season, from every angle
Nine views built on the scout files and attendance you record. Real screens from the demo account with made-up data; the app interface is currently in Italian.
What you can do with Statistics
Season overview
Wins, losses, sets and points with the change from the previous period.
Trends by skill
Attack and serve efficiency, positive reception and block points, game after game.
Match-by-match table
Every skill with each game’s value and the trend, colored so drops stand out.
Player statistics
Individual performance, season ratings and consistency for every player.
Clutch moments
How the team performs, and who, when a set gets tight.
Court zones
Performance maps by zone to see where points are won and lost.
How it works
- 1
Upload scout files
Every scouted match feeds the season statistics.
- 2
Choose the view
Performance, team or players, with filters by period.
- 3
Take the data to the gym
From a drop in reception to a targeted drill in Tuesday’s session.
From a feeling to a fact
“Our passing has dropped” is a feeling. A curve going down for three matches in a row is a fact you can build this week’s practice on.
Statistics come from the scout files you upload: the more files, the more reliable the trend.
Team and player, in the same place
Switch from the team view to a single player without changing tools. Player ratings also land in the player profile, next to attendance and injuries.
If you want, players can see their own statistics too; in the privacy settings you decide whether they can also see their teammates’.
A connected system
Statistics works together with
Frequently asked questions
Where does the data come from?
From the DataVolley scout files (.dvw) you upload after matches. Results entered by hand feed win rate, sets and points.
Can players see the statistics?
Yes, if they have an account with the player role. In the privacy settings you decide whether they see only their own or their teammates’ too.
Do I need many matches for useful data?
After a few games you already see the first trends; the more files you upload, the more reliable they become.
Statistics and 13 more sections, in one app.
Twenty seats in the private beta for coaches who want to build the platform with us. Big lifetime perks for whoever joins now.
Apply as a beta tester